Infographics
Infographics exist to make an argument creatively, beautifully, and succinctly. However, too often, they're used in a manner that doesn't make sense, confuses the point, or completely misleads the audience.
Before we look at a few examples to explore what NOT to do, here's a handy way of thinking about what visual representations are most appropriate for what you want your data to do.
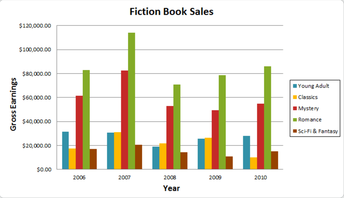
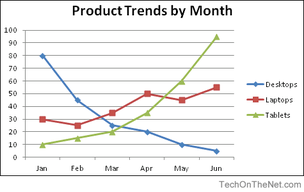
Compare values and analyze trends:

Bar Charts
|

Line Charts
|
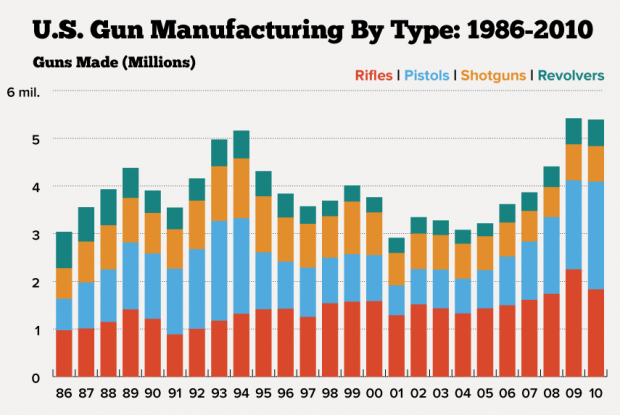
Show how individual parts make up a whole:
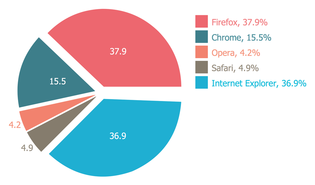
Pie Charts
|
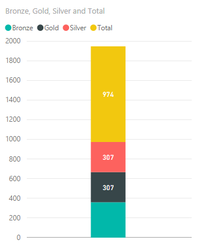
Stacked Column Charts
|
Stacked Bar Charts
|
Understand how data is distributed
Bar Charts
|
Line Charts
|
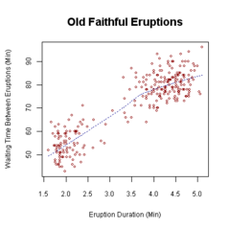
Scatter Plots
|
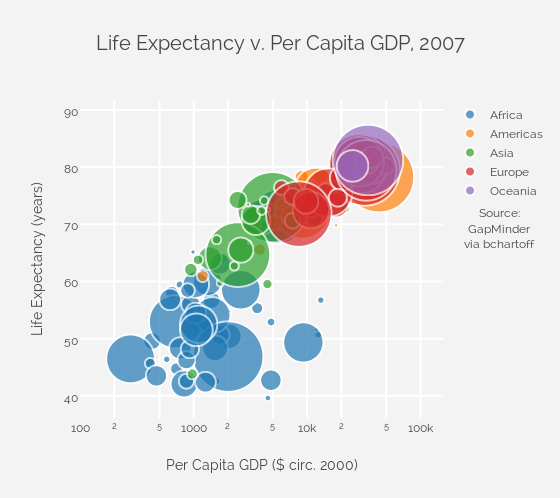
Bubble Charts
|
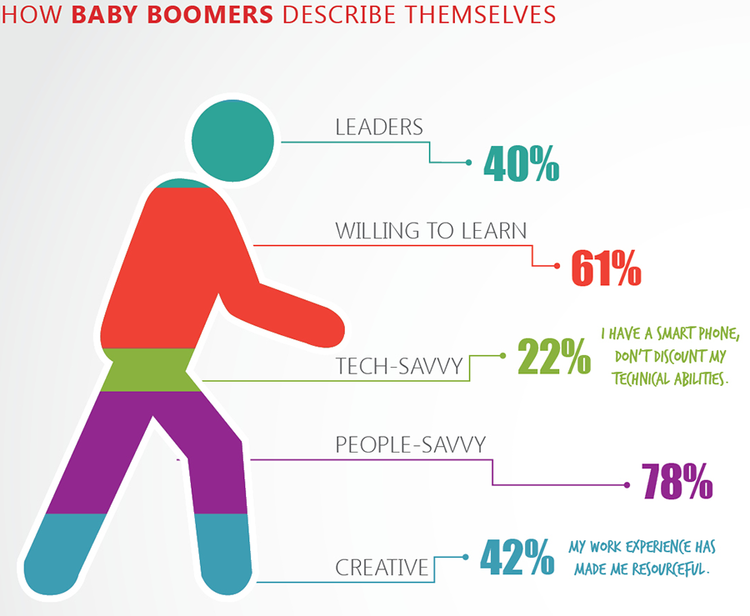
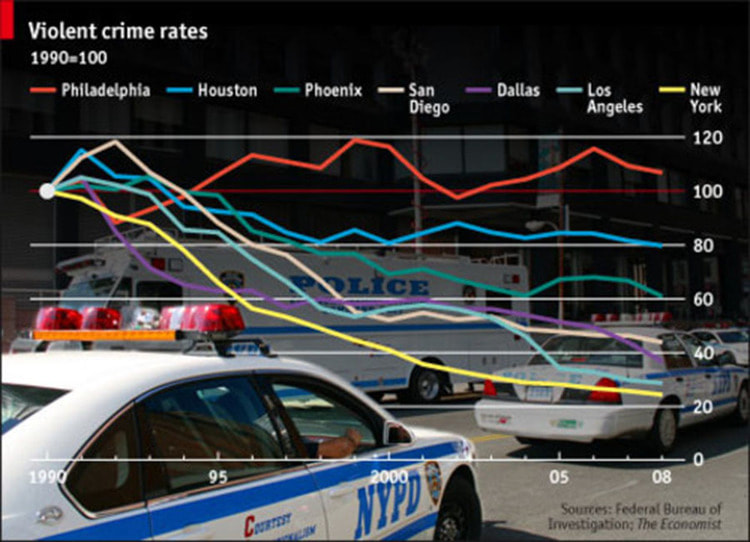
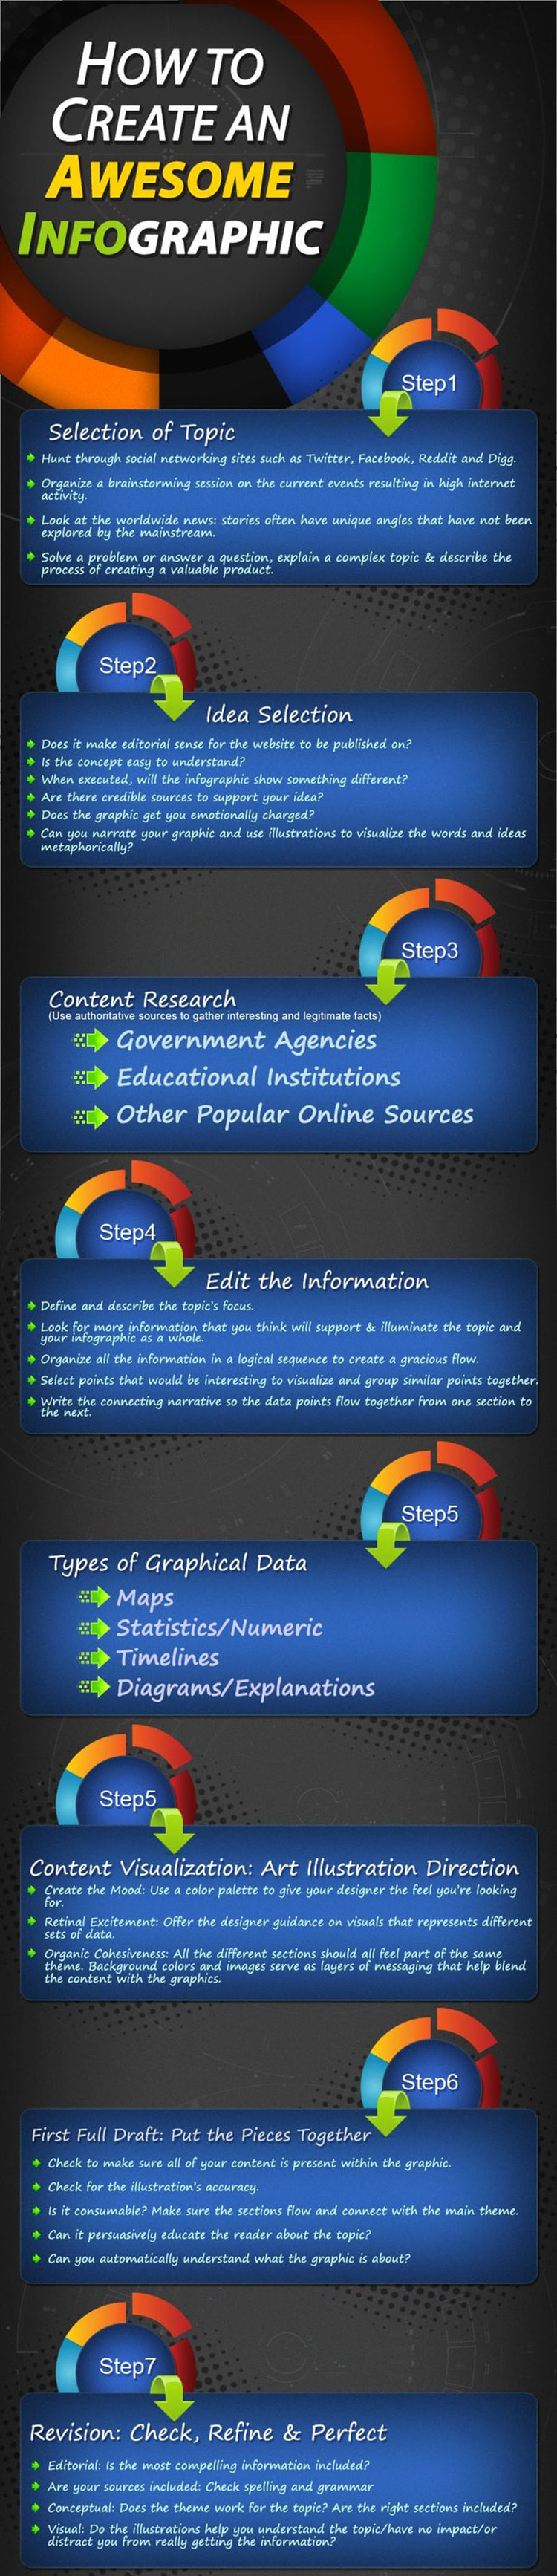
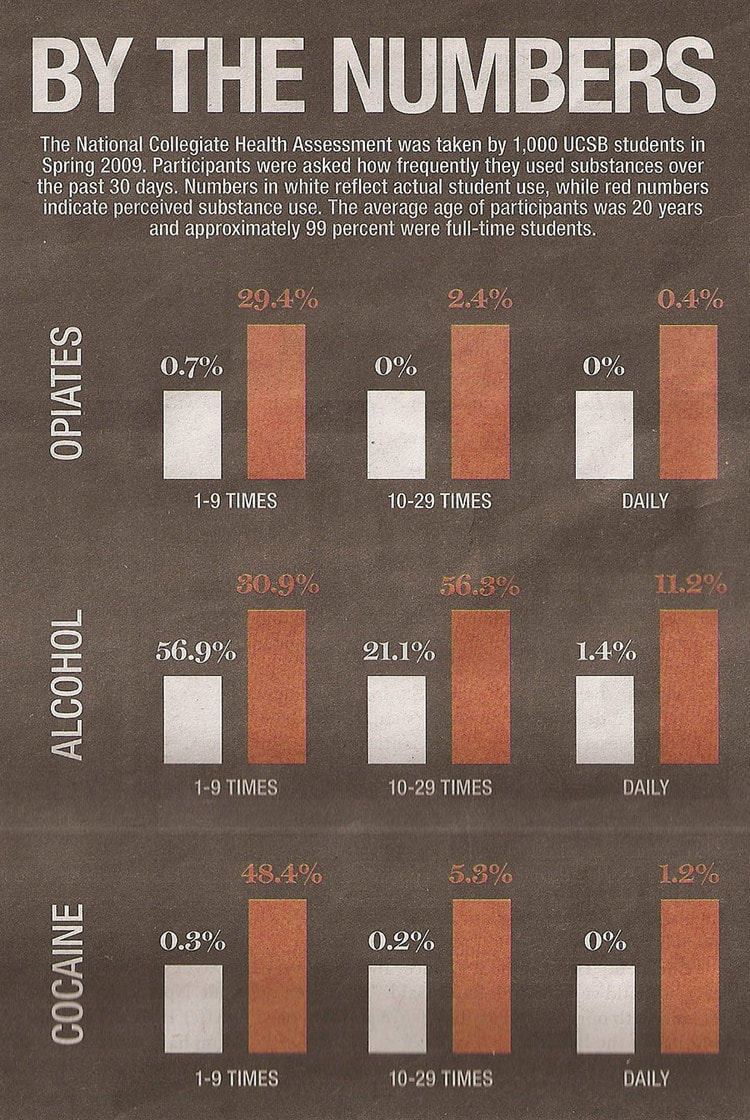
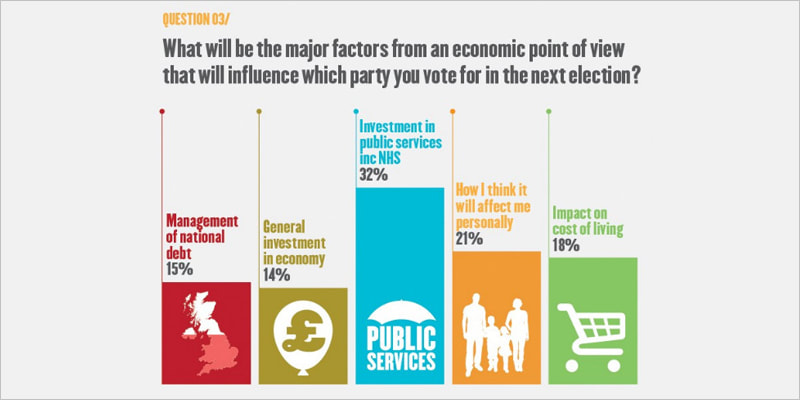
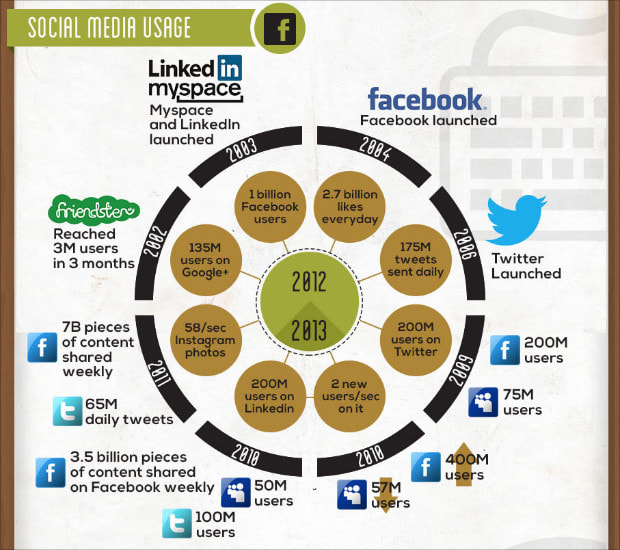
The Bad, the Misleading, and The Confusing
Why do you think each of these struggle to convey their message?
What do I recommend? Well David McCandless is my information visualization hero! Check out his website for inspiration. And the designer Stefanie Posavec is my creativity guru!
